Using Schwing Concrete Pumps Effectively
There are so many concrete pumps for sale in the market. Using a Schwing concrete pump nomograph will help you accurately select the best choice for your concrete pour job. Using such a calculation tool can seem like a difficult task, but it is easier than it looks.
Here at JED Alliance Group, Inc, we not only restore trailer pumps, boom pumps, and city pumps, we also pump concrete and have been doing it for many years. We have found the use of the nomograph calculation tool to be accurate and very helpful in selecting a concrete pump. Here is how it works.
Concrete Pump Sizing Example
To illustrate the use of this calculation tool, we will use the following example:
- Our concrete pour job requires an average output of 45 cubic yards/hr., but we will be pumping only 75% of the time. The rest of the time will be spent moving hose, removing pipe lengths, waiting for concrete trucks, etc. This means that when we are actually pumping, we will need an output rate of 45 yds3/hr ÷ .75 = 60 yd3/hr.
- We’ll use 5″ diameter pipeline for our job.
- We will have the following pipeline lengths: 30 ft. horizontal, 1 long sweep elbow, 250 ft. vertical, 2 long sweep elbows, 150 feet horizontal, 40 feet of 5″ rubber hose.
- We’ll specify a slump of 3-4″, so we will use the 3″ line on the nomograph chart.
- When we add the pressure for the vertical run (250 feet), we will have to add 1.1 times 250 ft. = 275 PSI.
All of these criteria will be explained in detail as we go through the description of using the nomograph’s individual quadrants. As we go through how to use the chart, keep in mind that three things limit what concrete pumps are capable of:
- Available power
- Maximum concrete output available
- Available maximum concrete pressure.
The Schwing Concrete Pump Nomograph
For a copy of the nomograph and more detailed usage instructions see page 163 of this Schwing concrete pump manual. Here is an overview of each quadrant in the order they are used:
- The upper left quadrant is the beginning and end point of the graph. It shows maximum output, pressure, and power for a specific machine.
- The upper right quadrant accounts for the relationship between output of concrete and pipeline diameters.
- The lower right quadrant accounts for the resistance to flow of the entire pipeline system.
- The lower left quadrant accounts for the pumpability of the concrete.
Using the nomograph
To use the nomograph, begin at the output required, and move in a clockwise direction until you encounter the lines that represent your job situation.
The starting point is the upper left quadrant (shown at right). It describes the power curve of a given Kw (kilowatt) rating, the maximum flow, and the maximum pressure of a particular concrete pump.
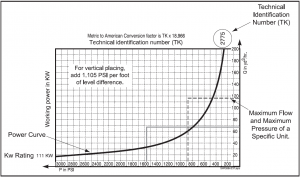
Upper left – power curve
Power Curve
Follow the chart in a straight line from “required output” into the upper right quadrant (shown at right) until you come to the size of the pipeline that you will use. A good rule of thumb for sizing pipeline is to use the largest diameter pipeline that you can. For example, it takes less force to move concrete through a 6″ pipeline than a 4″ pipeline.
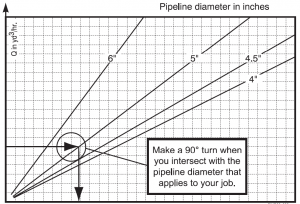
Upper right quadrant – Pipeline diameter
Pipeline diameter
The lower right quadrant (shown at right) introduces the pipeline criteria. It accounts not only for the length of the pipeline, but also the number of bends, the increased resistance of flow in rubber hose, etc. It is actually more a measure of the resistance to flow than a length measurement.
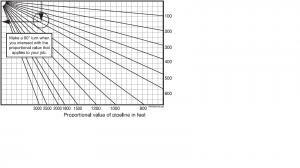
Lower right – proportional value of pipeline
Proportional Value Of Pipeline
To calculate the proportional value of your pipeline, the following criteria will apply:
- each 90° bend with a radius of 250 mm (boom elbow) = 3.5 feet
- every 90° bend with a radius of 1 meter (long sweep) = 10. feet
- each 30° or 45° bend with a radius of 1 meter or 250 mm = 3 feet
- every section of rubber hose causes 3 times as much resistance as the same length of steel pipe, e.g., 12 feet of rubber hose has the same resistance as 36 feet of pipeline.
- all horizontal and vertical distances are figured equally. The increased pressure required to push concrete vertically is accounted for by adding pressure, not distance.
Our example pipeline is at the right:
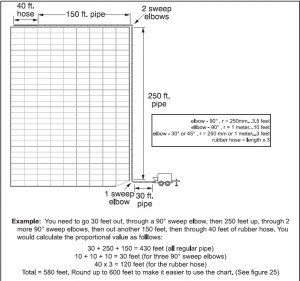
Now you have calculated the proportional value of your pipeline. You can extend your line down from the upper right quadrant until it intersects with the line that represents your pipeline. When you reach the intersection, make a 90° turn clockwise, into the lower left quadrant (shown below). As noted above, we will use 600 feet as our proportional value.
If the concrete specifications allow a range in slump (for example 3 – 4″), you should always use the lower end to be safe. In our example, we use 3″ slump. So we extend the line from the lower right quadrant until it intersects with the 3″ slump line, then make a 90° turn clockwise. This will lead you back into the upper left quadrant through the pressure scale.
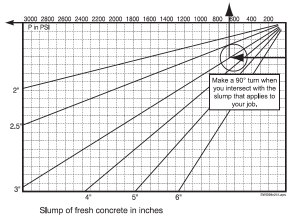
Lower left – pumpability of the concrete
